
News
Getting your head around the distribution of funding
15 January 2019
Guest post by Kimberley Anscombe of Oxford Consultants for Social Inclusion (OCSI).

Nearly 100 grantmakers are now publishing their funding as open data via 360Giving, making it possible to get a richer, fuller picture of the funding landscape across the UK. And for individual funders, publishing data in a standardised format makes it easier for them to see where their grantmaking fits in. A winner all round!
The next step is to use this data alongside other datasets so that it can provide more context and inform decision making.
Grantmakers are often interested to see their funding by geography. In this blog post we provide a step-by-step guide to calculating your grant funding data based on per head of the population, using Microsoft Excel. We hope you find it useful!
Why calculate grant funding as per head of the population?
Calculating your grant funding as per head of the population is a useful way to ensure that you are comparing like for like, when looking at the distribution of grant funding across geographies with differing population sizes.
This is particularly pertinent when looking at wards, which can differ greatly in size, with the biggest ward containing 43,359 people (City & Hunslet, Leeds) to 162 people (St Martin’s, Isles of Scilly) at the other extreme.
For example, if you saw that City & Hunslet had received funding of £4 million during 2017 and St Martin’s had received £48,600 – at first glance, it may seem St Martin’s are getting a rough deal. But per head of the population, this equates to £92 per head for City & Hunslet and £300 per head for St Martins.


Step-by-step: Your guide to calculating grant funding data per head of the population
The step-by-step guide below is for data that you hold at LSOA level. If you hold your grantmaking data at postcode level, there are a few additional steps to take, in order to convert your postcode data to LSOA data. If you would like some advice on this, get in touch on info@ocsi.co.uk
What you will need:
- Your grantmaking data, ideally in an Excel spreadsheet, with a corresponding LSOA code for each row of data (the beneficiary location).
- ONS Small Area Population Estimates (the link to the most recent data is in the guide below).
1. Decide which time-point to analyse
- Keep it simple at the start and choose a finite time point; perhaps either a calendar year or a financial year for which you have collected data.
- Filter your data and copy the data for your selected time-point into a new spreadsheet.
2. Check data for any missing cells
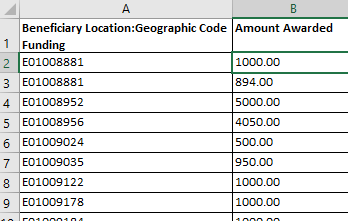
- Copy the column that holds your grants awarded data and the column that holds your LSOA codes (it should look something like this: E01031005) into a new Excel document. If you don’t hold your data at LSOA level, get in touch to talk through your data.
- Ensure the columns are named clearly.
- Depending on how many rows of data you have, you can check manually to see if any geographic data is missing:
- For missing data, you can assign an LSOA. For example, if you know the postcode of the beneficiary location, there are postcode to LSOA lookups available. Simply search for the postcode you are interested in, and find the corresponding LSOA code (word of warning: it is a pretty large file).
- Alternatively, you can pop your postcodes into the IMD by postcode lookup, which will produce a file with the corresponding LSOA (as well as deprivation data on that postcode too).
- If you have no information on the beneficiary location available, remove the whole row of data.

3. Reformat your data to remove duplicate rows of LSOAs
- Its possible that multiple grants were given to the same LSOA. In order to have one summed grants awarded figure for each LSOA, you need to:
- Highlight the columns with your location data and amounts awarded data
- Create Pivot Table by going to Insert -> PivotTable
- You will then need to use the PivotTable Fields to format your data:
- Drag and drop the data about the location of your grants into the ‘Rows’ box
- Drag and drop the amount awarded data into the ‘Values’ box
- Ensure that the Values box states the data is being summed (if it isn’t as default, click on the drop-down within the ‘Values Box’ -> click Value field settings and select Sum from the choices)
- This table then will give you a summed total for each LSOA and this is the data you will want to use in order to calculate grant funding per head of the population.
- Copy the data from the Pivot Table and paste as values (to do this, right click on the cell you want to paste the data into -> click on Paste Special -> select paste as values option) into a new sheet.
- This is the sheet you will now work from.

4. Download population data
- Download the Mid Year Population Estimates for small areas, published by ONS (using the time-point that most closely resembles the grant-making data).
- The raw data can be downloaded from here.
- Open sheet ‘Mid-2017 Persons’ (or the respective sheet for the year you are looking for).
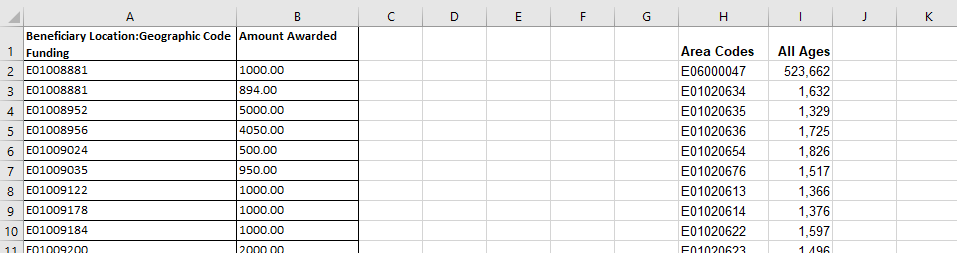
- Copy columns containing the LSOA code information (called LSOA11CD) and the data on total population (called All ages) into the Excel document with your summed grants awarded and LSOA data.
- Leave a few blank columns in between the grants data and the population data.
- Leave a few blank columns in between the grants data and the population data.

5. Match the LSOAs from the funding data to the corresponding population data
You can do this using a vlookup in Excel. The following guidance assumes you have the data in the following columns:
A – Beneficiary location (LSOA codes)
B – Amount Awarded
H – Area Codes (for the population data)
I – All ages population data
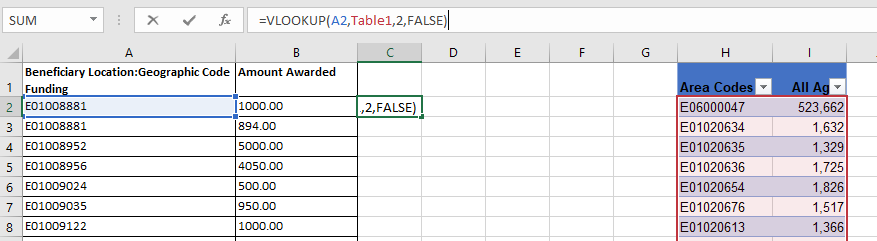
- Select all the cells that contain the population data (Columns H & I).
- Turn this data into a table by clicking Insert -> Table.
- In column C, next to your first row of data, enter this formula: =VLOOKUP(A2,Table1,2,FALSE).
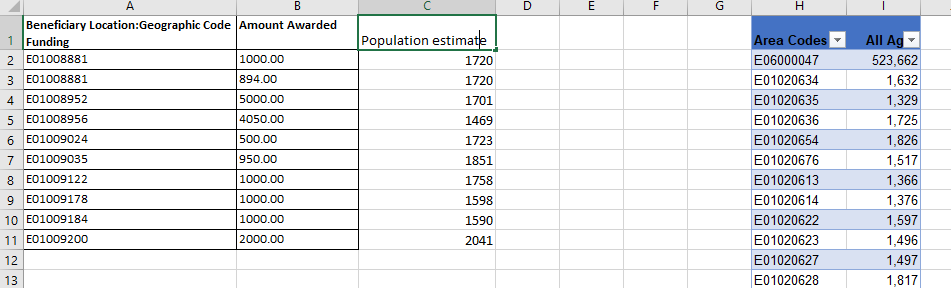
- Double click on the bottom right corner of the cell you entered the formula in to complete the rest of the column.
- This should give you the corresponding population estimate for each of the LSOAs in Column A.
- Name the column clearly (e.g. population estimate).

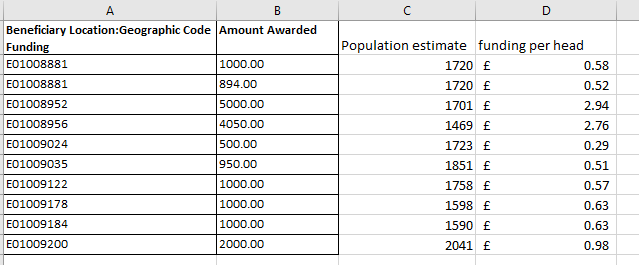
6. Calculate the amount of grant funding per head
- You should now have an Excel document with three columns of data:
- Column A: LSOA code
- Column B: Grant funding (£)
- Column C: Population estimate
- In column D (you could call this ‘funding per head’), enter the formula to divide the grants data by population data (=B2/C2).
- Double click on the bottom right hand corner of the cell, to copy the formula to the rest of the column.
- Adjust the formatting so that the column displays as £
- To do this highlight the column, right click and select format cell, then select Currency under the category heading and select the pound symbol.
- To do this highlight the column, right click and select format cell, then select Currency under the category heading and select the pound symbol.

Next steps
Hoorah! You now have your grant funding data per head of the population.
From here, the world is your oyster:
- Use your data to create charts, data visualisations and maps, which can be used in reports and presentations.
- Use your data to calculate values for other geographies, such as wards.
- Compare your grants per head data to your raw grants data to get a different view of cold spots.
- Compare your grants per head data to other datasets such as the Index of Multiple Deprivation, to see whether your funding is matching local need.
- Go one step further and tailor the population figures to eligible grantees (for example, for funds that are specifically for women, use the female population estimates).
And if you want to do all of these things quickly and easily (with heaps of extra benefits thrown in), sign up for a free trial of Local Insight and:
- Upload your grants data to Local Insight and access maps & dashboards for your data
- See your data instantly aggregated to the local areas you care about – whether that’s wards, parishes or funding patches.
- Explore Big Lottery grant funding, which has been added as a dataset for all users of Local Insight
OCSI’s Local Insight tool brings together hundreds of local level datasets, instantly aggregated to any geography or area. It is used by a number of foundations to help tell stories with data and inform grantmaking. Foundations are also able to add their own grantmaking data (including their 360Giving data) to Local Insight, providing insights into whether local giving matches local needs.